Dun & Bradstreet’s India Business Optimism Index declined by 5% on a q-o-q basis
Dun & Bradstreet’s India Business Optimism Index declined by 5% on a q-o-q basis, but increased by 12.5% on a y-o-y basis
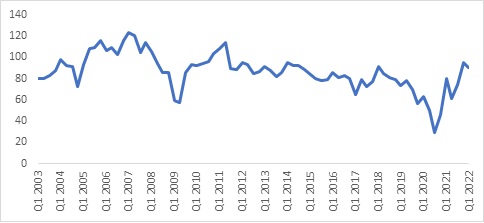
Mumbai, February 10, 2022: The Dun & Bradstreet Composite Business Optimism Index stands at 89.9 for Q1 2022, a decline of around 5.0% compared to the Q4 2021 survey. Four out of six optimism indices have registered a decline as compared to Q4 2021. The Business Optimism Index, which has been measuring the changing business sentiment of India Inc. since 2002, is a leading indicator for India’s overall growth with a correlation co-efficient of 80% with the Gross Domestic Product (GDP).
Highlights
- The Dun & Bradstreet Composite Business Optimism Index stands at 89.9 for Q1 2022. The index decreased by around 5.0% on a q-o-q basis but increased by 12.5% on a y-o-y basis.
- Optimism for volume of sales stands at 73%, a decrease of 6 percentage points as compared to Q4 2021
- Optimism for new orders stands at 69%, a decrease of 10 percentage point as compared to Q4 2021
- Optimism level for net profit stands at 62%, at the same level as in Q4 2021
- Optimism for the level of inventory stands at 37%, a decrease of 1 percentage point as compared to Q4 2021
- Optimism for selling price stands at 47%, a decline of 2 percentage points as compared to Q4 2021
- The construction sector is the most optimistic on all parameters except level of selling price
Dun & Bradstreet's Composite Business Optimism Index: Q4 2002 – Q1 2022

Note: BOI Index is for new base (2011)
“The survey for Dun & Bradstreet Business Optimism Index was conducted in December 2021, when the Omicron variant was spreading faster, forcing countries to introduce mobility restrictions. The Index shows that optimism level of India Inc. dropped in Q1 2022 after surging to an almost eight-year high in Q4 2021. Concerns that the new variant would restrain the revival in demand and slow down the recovery would have weighed upon the sentiment of businesses,” said Arun Singh, Global Chief Economist, Dun & Bradstreet.
“On a positive note, the optimism level was higher by 12.5% compared to the same quarter last year. Nonetheless, the point of concern, as well as the focus, for the government and the Reserve Bank India (RBI) should be small businesses. There is a need to continue to extend the support measures, as our survey found that small businesses were the least optimistic across all the parameters, except for selling price, reflecting the difficult operating environment and market conditions under which they are working. Looking ahead we expect that the high vaccination rate will help states to withdraw all forms of restrictions, lending buoyancy to business optimism levels, although risks to businesses prevail from outflows of foreign investment, an increase in lending rates and slowdown in global growth”,
Key findings from the Q1 2022 survey
Around 73% of the respondents expect volume of sales to increase in Q1 2022 compared to 79% in Q4 2021, a decrease of 6 percentage points. While around 21% expect it to remain unchanged, around 7% expect the volume of sales to decline.
62% of the respondents expect an increase in net profits in Q1 2022, same as in Q4 2021. 28% expect net profits to remain unchanged, while 10% expect it to decrease.
48% of the respondents expect no change in the selling price of their products in Q1 2022. 47% of the respondents expect the selling price of their products to increase during Q1 2022, while 5% expect a decline.
69% of the respondents expect their order book position to improve in Q1 2022, compared to 79% in Q4 2021, a decrease of 10 percentage points. While 27% of the respondents expect new orders to remain unchanged, only 4% anticipate new orders to decrease.
37% of the respondents expect their inventory level to increase during Q1 2022, compared to 38% in Q4 2021, a decrease of 1 percentage point. While another 47% anticipate no change in inventory level, 16% expect inventory level to decline.
49% of the respondents expect an increase in the size of their workforce employed during Q1 2022, the same as in Q4 2021. While 48% anticipate no change in the number of employees, 3% expect their workforce size to decline.
About the Dun & Bradstreet Business Optimism Index
The Dun & Bradstreet Business Optimism Index is an indicator and measure of the pulse of the business community. The index is arrived at on the basis of a quarterly survey of business expectations.
The survey is conducted on a sample of companies that are selected randomly from Dun & Bradstreet’s commercial credit file. The sample selected is a microcosmic representation of the country’s business community and includes companies from several sectors including basic goods, capital goods, intermediate goods, consumer durables, consumer non-durables and service sectors. All the respondents in the survey are asked six standard questions regarding their expectations as to whether the following critical parameters pertaining to their respective companies will register an increase, decline or show no change in the ensuing quarter as compared to the same quarter in the prior year: Volume of Sales, Net Profits, Selling Prices, New Orders, Inventories and Employees. The individual indices are then calculated by the percentage of respondents expecting an increase.
For calculating the Composite Business Optimism Index, each of the five parameters (excluding inventory) is assigned a weight. The positive responses for every parameter for the period under review are expressed as a proportion of positive responses in the base period (2011). The parameter weights are then applied to these ratios and the results aggregated to arrive at the Composite Business Optimism Index.
